

From Chaos to Clarity
Best Practices in Research Data Management and Analysis

In today’s data‐driven world, the success of scientific projects increasingly hinges on effective data management and analysis. As datasets grow in size and complexity, researchers must navigate issues ranging from distribution requirements in field studies to the limitations of traditional statistical methods. Additionally, machine‐learning techniques are becoming increasingly integral to data analysis, offering both user‐friendly interfaces and coding options for efficient data processing and visualization.
This article aims to provide valuable insights into best practices for data management, storage, handling, and analysis, offering guidance that will benefit graduate students and early career researchers alike.
Data Organization
The difference between scientific clarity and chaos often boils down to one thing: data organization. It’s not just about keeping things tidy—but making sure your data is easy to find, trustworthy, traceable, and safe throughout your research and afterwards.
Here’s how you can systematically approach data organization to set your research up for success:
Practice Clear File‐Naming Conventions
The basics of effective data management lie in implementing a clear and consistent file‐naming system. While seemingly obvious, this initial step is crucial for maintaining data organization and traceability. Rather than utilizing generic labels such as “data1” or “final,” researchers should employ a descriptive naming system that incorporates essential metadata. For instance, a file named “WheatDwarfbuntdata_Logan_20240901.csv” immediately conveys the data type, geographical origin, and collection date. This practice significantly enhances data accessibility and interpretation, particularly in collaborative research environments.
Implement Version Control
Data collection and analysis inevitably lead to updates and revisions. Effective management of these changes can be achieved through the implementation of version control. Modifications to datasets should be saved with updated version numbers—e.g., “WheatDwarfbuntdata_Logan_20240903_PJ.csv.” This method allows changes to be tracked over time and ensures the preservation of earlier versions. A good practice could be the archiving of previous versions in a separate folder or an online resource. For larger projects, version control tools like GitHub can be utilized, offering a more sophisticated approach to change management, collaboration, and maintenance of data history.
Backup Stored Data
Data security and accessibility can be ensured through the use of cloud‐based platforms such as Google Drive, Dropbox, OneDrive, and Box. These platforms provide centralized storage that can be accessed by the entire team from any location. Basic version control features are also offered by these platforms, facilitating easy tracking of changes across different data versions. However, reliance on cloud storage alone is not sufficient. Additional security can be achieved through regular backups of data on external hard drives, ensuring data safety even in the event of cloud storage issues, such as service outages or cyberattacks.
Document Your Methodology
A thorough documentation of data collection and analysis methods in an extensive metadata file or datasheet is crucial for data organization. Detailed records of tools used, procedures followed, and any changes made should be kept, allowing efficient tracing of data. As a rule of thumb, it is often recommended to provide more details rather than less, to ensure data traceability. This documentation should be stored alongside data files, enabling future users or reviewers to understand the collection and processing methods. The reproducibility of research, an important aspect of scientific integrity, is enhanced by well‐documented protocols. When the time comes for report or manuscript writing, this extensive metadata information proves more than handy.
Data Analysis
Once the data is collected and organized, it is also important to maintain a clear flow in data analysis until reporting. A well‐structured data flow ensures methodical and reproducible data processing from raw collection to final analysis. The process begins with data ingestion from various sources, followed by compiling and cleaning to convert raw data into a usable format (e.g., Microsoft Excel datasheet). Data integration combines information from multiple sources, ensuring consistency across different data streams such as collaborators. Having well‐defined protocols automates the sequence of tasks from preprocessing to final analysis, facilitating reproducibility and scalability. The final stage involves generating output datasets ready for analysis, accompanied by comprehensive documentation for future reference.
Here are the steps that could help maintain a seamless flow for data analysis:
Data Cleaning and Preprocessing
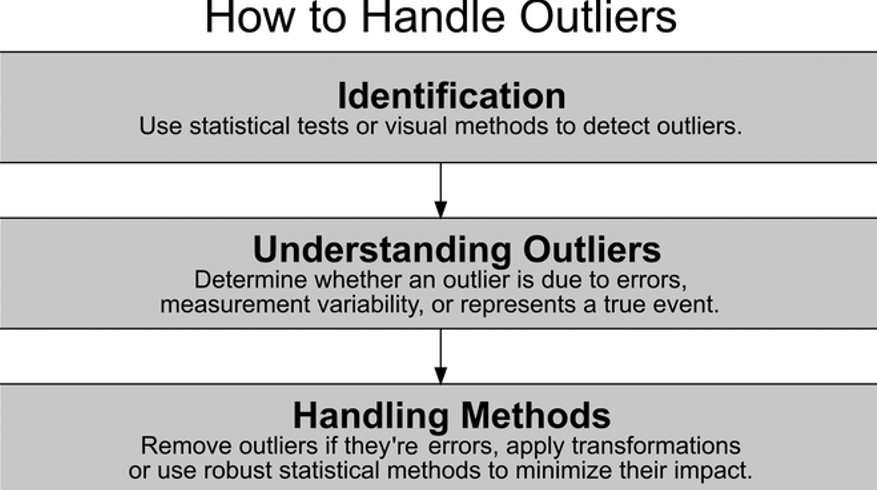
Data cleaning and preprocessing are crucial first steps in data analysis, involving the identification and rectification of errors, inconsistencies, and missing values. Key techniques include handling missing data through imputation or deletion methods and data normalization to ensure variables are on the same scale. Deduplication is essential for maintaining data integrity by removing redundant entries. Outlier detection and handling (Figure 1), using statistical methods or visualization techniques, helps identify and handle extreme values that could skew analysis results.
Exploratory Data Analysis and Visualization
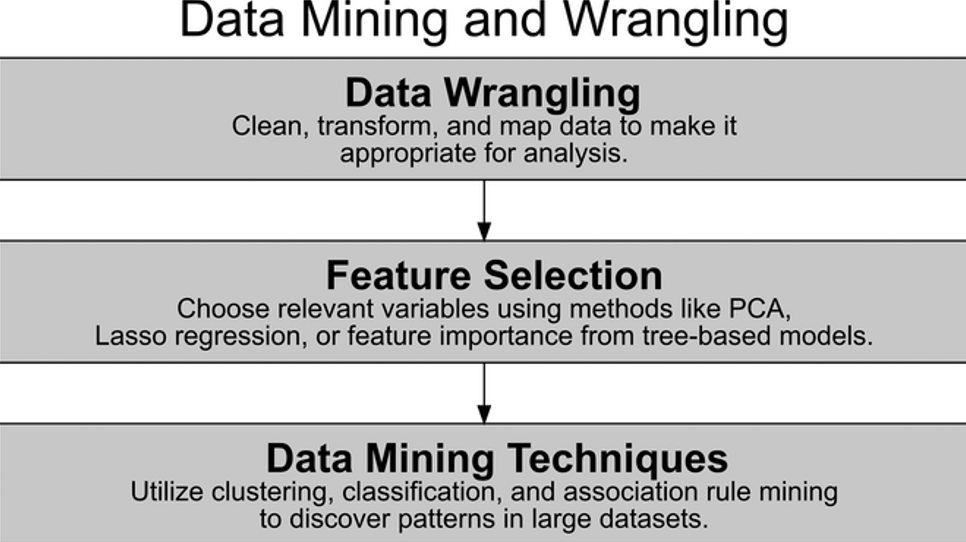
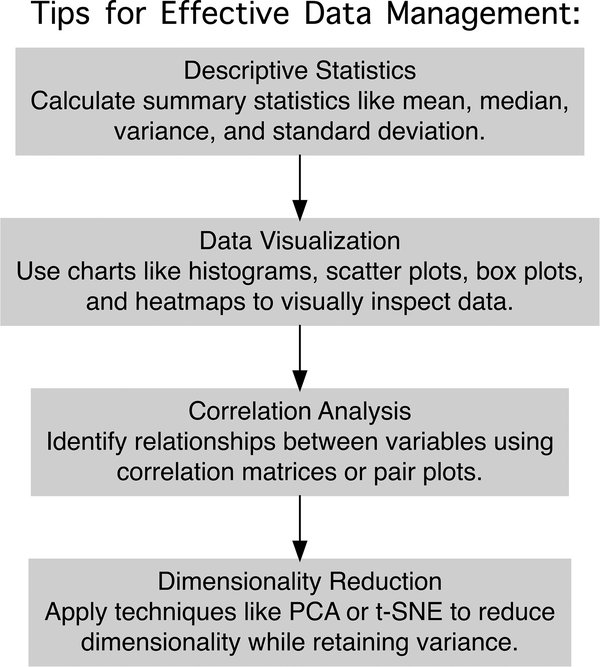
Data mining and wrangling (Figure 2) helps to extract meaningful patterns from raw data and transform it into a suitable format for analysis. Exploratory data analysis (EDA) and visualization provide insights into data structure and patterns. Descriptive statistics offer a numerical summary of data distribution while visual representations like histograms, scatter plots, and box plots allow for intuitive grasp of complex patterns and relationships. Correlation analysis helps identify relationships between variables, aiding in the detection of multicollinearity and informing feature selection. For high‐dimensional datasets, dimensionality reduction techniques like PCA or t‐SNE can project data onto lower‐dimensional spaces while preserving structure, facilitating visualization and potentially revealing hidden patterns.
Statistical Methods and Modeling
Statistical methods and modeling form the analytical backbone for drawing inferences and predicting outcomes. Inferential statistics extend findings from samples to larger populations using hypothesis testing, confidence intervals, and p‐values. Regression analysis, including linear, logistic, and multiple regression, models relationships between variables and makes predictions. Recently, machine‐learning models offer flexible approaches to pattern recognition and prediction, particularly useful for complex, high‐dimensional data. Supervised learning techniques like random forests and support vector machines can be used for classification and regression tasks while unsupervised learning methods such as k‐means clustering discover inherent data structures. Model evaluation, using metrics like accuracy, precision, recall, and AUC‐ROC, ensures chosen models perform well and generalize to new data.
Data Validation
Data validation is a multi‐phase process: it starts before data collection, continues through methodology development, and concludes during analysis. First, good data come from a well‐defined research question and a solid experimental methodology, emphasizing careful planning to avoid bias.
In biological research, natural factors—such as weather or soil variations—can lead to missing data or experimental gaps. Therefore, the second phase of validation involves documenting inconsistencies, treating data points consistently, and routinely checking smaller datasets for accuracy. The latter is especially critical for large datasets.
The final phase, closest to formal analysis, requires the analyst to understand the research goals, data structure, and hypotheses. Analysts must check for issues like missing values, duplicates, formatting errors, and data type mismatches. It’s also vital to verify the biological relevance of the data: for instance, does a negative crop yield make sense? Does a 30% organic carbon content seem reasonable? These are the nuances only the researcher can evaluate.
Handling Missing Data
In the process of ensuring data validity, we often encounter an unavoidable challenge: missing data. Fortunately, scientific methodology provides strategies to handle this issue effectively. In cases where experiments have been properly replicated, even with missing data, variance can still be estimated. However, not all missing data is easy to manage.
Missing data can fall into three categories: Missing at Random (MAR), Missing Completely at Random (MCAR), and Missing Not at Random (MNAR):
- Missing at Random (MAR): This type of missing data depends on factors we already know, such as soil type, weather conditions, or a specific experimental block. In these cases, the missing values can often be predicted based on the rest of the dataset.
- Missing Completely at Random (MCAR): This data is missing without any discernible pattern, and its absence is not related to the data itself. For example, data might be lost due to random equipment malfunction. In such cases, removing the missing data usually won’t introduce bias, and the analysis remains
reliable. - Missing Not at Random (MNAR): This type of missing data occurs due to the variable we are trying to mea- sure. For instance, in a survey, participants might skip sensitive questions, leading to gaps that are directly related to the content of the missing data. Simply deleting these observations could introduce bias, so a more careful strategy, such as modeling or imputation, is necessary.
Once the type of missing data is determined, several strategies can be employed to handle it. Simple deletion methods, like listwise or pairwise deletion, can be effective for MCAR data but may introduce bias if the data is MAR or MNAR. In these cases, imputation techniques like filling in missing values with the mean, median, or mode might be more appropriate. More advanced methods, such as linear mixed models or machine‐learning algorithms, can handle more complex or unbalanced datasets.
No matter which strategy is used, it’s essential to clearly report how missing data handled in the analysis. Transparency ensures that the results remain credible and the analysis is unbiased.
Data Transformations
In research involving experimental or biological data, statistical models (e.g., t‐tests, variance, or regression) are frequently used to explore treatment effects. These models rely on key assumptions, such as the ones for linear models: linearity between response and predictor, normal distribution of residuals, homoscedasticity, and independence of observations. Once a linear model is fitted to the data, these assumptions must be tested. If any assumption is violated, the results could be biased or inaccurate.
Data transformations—such as log or square root transformations—are simple ways to stabilize variance and meet model assumptions. Other transformations, like the cube root or box‐cox, can also improve the model’s efficiency. If transformations do not work, more complex models, such as mixed models, might be necessary.

Result Interpretation and Reporting
If best practices have been followed throughout data management and analysis, interpreting and reporting results should be straightforward. It’s important to stay grounded: your results should answer your research question and support (or refute) your hypothesis. If your data does not support your hypothesis, use it to generate new ideas.
Effective reporting of findings involves clarity and accessibility. Whether for scientific journals, extension materials, or presentations, your results should tell a compelling story backed by clear, reliable data. Combining visual appeal with accurate information ensures your findings are understood by your target audience and reflect the hard work that went into adopting best data management practices.
Data Sharing Collaboration and Long‐Term Storage
Data sharing and collaboration have become cornerstones of modern research, fostering transparency, reproducibility, and accelerated scientific discovery. While data sharing enables verification, refinement, and remote collaboration, it also presents challenges in data privacy, intellectual property, and standardization. Effective sharing requires meticulous documentation, regular updates, and well‐maintained citation practices. Long‐term data storage poses its own set of challenges, demanding ongoing funding for website maintenance, cloud storage solutions, and the implementation of robust preservation strategies to ensure data remains accessible and meaningful over time. These efforts collectively contribute to a more interconnected and efficient scientific community, capable of tackling increasingly complex global issues. Several of the data storage and sharing platforms such as OneDrive, Box, etc. are commonly provided by universities to students and researchers for free. Further, university libraries can be a go‐to place for additional support and resources on data management.
Conclusion
These recommendations for efficient data management(Figure 3) can be adjusted as needed in your research. Effective data management now demands meticulous organization, cleaning, and documentation to ensure accessibility and reproducibility. This landscape of challenges and opportunities underscores the critical need for robust data‐handling strategies, sophisticated analytical methods, and improved statistical literacy among researchers. By addressing these key areas, scientists can enhance the efficiency, reproducibility, and impact of their work in an increasingly data‐driven research world.
Connecting With Us
If you would like to give us feedback on our work or want to volunteer to join the committee to help plan any of our activities, please reach out to Ariana Lazo ([email protected]), the 2024 Chair of the committee!
If you would like to stay up to date with our committee, learn more about our work, contribute to one of our CSA News articles or suggest activities you would like us to promote, watch your emails, connect with us on
Twitter (@ACSGradStudents) and Facebook (ACS.gradstudents), or visit: agronomy.org/membership/committees/view/ACS238/members, crops.org/membership/committees/view/ACS238/members, or soils.org/membership/committees/view/ACS238/members.
Text © . The authors. CC BY-NC-ND 4.0. Except where otherwise noted, images are subject to copyright. Any reuse without express permission from the copyright owner is prohibited.


